

Launch of a Monthly Newsletter
A Crazy Idea, Let’s do it!!
Welcome to our initial launch of a monthly newsletter. Within this regular publication, we plan to spotlight enhancements made to the HIMPACT system and other useful topics to make our customers’ buyers better users and more efficient.
With so many customers at different levels of exposure to and proficiency with the HIMPACT system, we hope this publication will help buyers by giving them snippets of best practices and other helpful tips. Our thought was to publish a Monthly (or Bi-Monthly) Newsletter to highlight topics we see and hear buyers struggling with from time to time. The design is also to remind buyers that we are always here for them.
We’re going to go back to basics to start off on the right foot and at the right level with the new and enhanced ITEM FORECASTING Screen. This enhancement will work to assist all buyers in making the most informed decisions. In this edition, we highlight 2 recent enhancements made to the item forecasting screens, the separation of the Periodicity and the dual display of the Graphs.
The intention here was to show buyers as much data as clearly as possible to make the forecasting and profiling process as clear as possible by visually representing what the numbers are showing them. It also shows how we listen to the buyers and work to get them what they request as much as we are able to, in order to help them be as successful as possible.
“From the request from a buyer at Maurice Sporting Goods in Northbrook, IL,
a request to have the graphs displayed with the history grid.”
Hopefully, you all have noticed this recent enhancement. If not, keep an eye out for this plus sign on the top of the History grid.
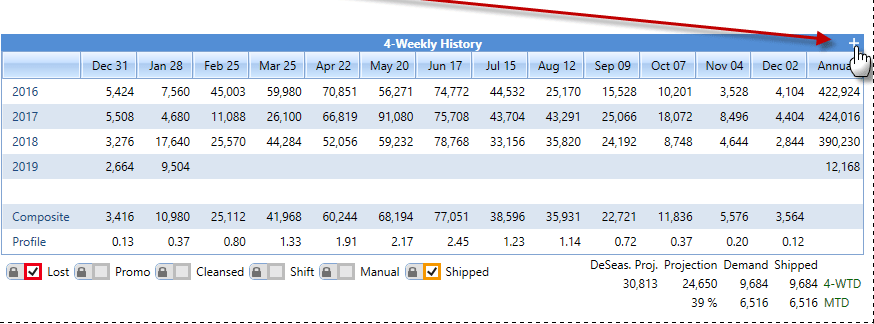
By clicking on the plus sign the screen expands to allow you to see the graph you choose!!
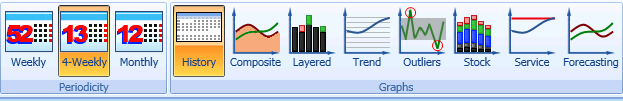
When displaying the History Periodicity, another recent change was made to segregate the Periods and the graph options. Note that they are now separated and allow you to choose which period you want to look at and the graphs and History grid will all be changed to the choice you select.
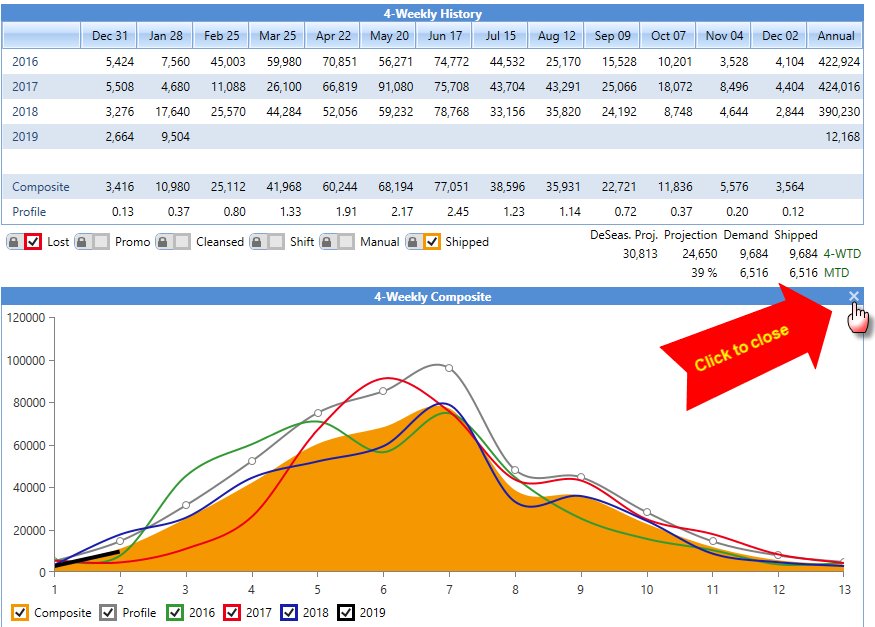
The new enhancement of the graphs being displayed below the History Table will now be even more impactful to buyers as they analyze items to make buying decisions for their companies.
As in the example shown, the buyer is now able to see the history in numbers and also able to see the Composite graph as a display of how the item has behaved. It will assist in the profile and making sure it’s to the buyers liking.
To request additional training please contact Bryan Cox, Manager of On Boarding & Buyer Support at bryan@herlitzim.com.